Presenting data in a visual way can make it much easier to understand.
That’s why it’s so important to us to continually add graphical elements to LabTracks. Click on the links below to see what we’re talking about.
Visuals:
+ Homepage featuring a user-specific calendar
+ Rack map visuals with “cage days” statistics for census and optimizing cleaning schedules
+ Chart graphic for tracking and improving breeding performance
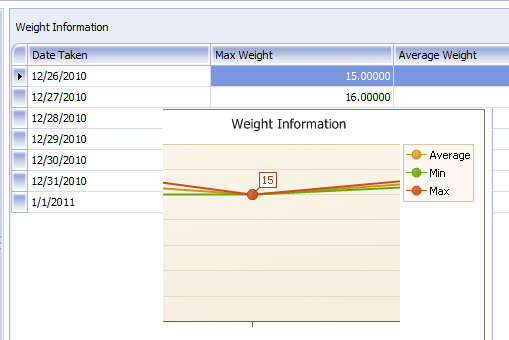
+ Ability to easily analyze statistics (such as weights) using graphs
Like what you see?